Big data
There are currently about 4.66 billion active internet users worldwide; these individuals each leave a data trail on the internet.
John Mashey, a computer scientist, is thought to have coined the term “big data” in the early 90s, but the concept started to gain traction in the early 2000s.
The advent of the Internet of Things (IoT), smart and connected devices, social media, etc. are among the reasons for the use of the big data term. Humanity is generating huge volumes of data, and fast too!
The definition of big data is data that contains greater variety, arrives in increasing volumes, and has more velocity, also known as the three Vs.
This is essentially what big data is: data that is so large, fast, complex, and impossible to process using conventional data processing methods.
Big data is a combination of structured, semi-structured, and unstructured data.
Although it doesn’t equate to any specific volume of data, big data deployments often involve terabytes, petabytes, and even exabytes of data created and collected over time.
Today, big data has become capital.
Data collected by organizations is used in machine learning projects, predictive modeling, and other advanced analytics applications.
Big data processing software and advanced data storage have become common components of data management architectures in organizations.
Recent technological breakthroughs have reduced the cost of data storage and big data computing, making it easier and less expensive to store more data than ever before.
Types of Big Data
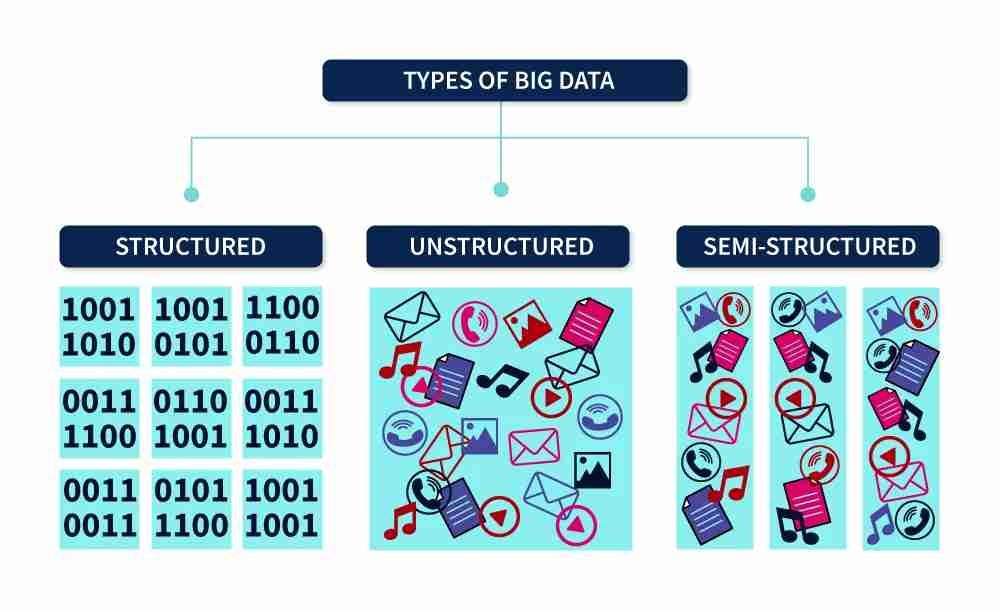
1. Structured data
This is the kind of data that is already stored in databases and can be processed, stored, and retrieved in a fixed format.
It is the easiest type of big data to work with as it doesn’t require special preparation before its analysis.
You can think of structured data in terms of the neat rows and columns you might see in an Excel spreadsheet.
Specific elements defined by certain variables are easily discoverable.
Structured data follows schemas, a road map that outlines where each datum is and what it means.
Sources of structured data can be either machine-generated or human-generated (e.g., filling out a form online).
Structured data accounts for just a small proportion, about 20%, of big data.
These data are stored in data warehouses, and examples include quantitative data, e.g., age, billing, contact details, address, and debit or credit card numbers.
2. Unstructured data
As the name suggests, unstructured data denotes completely unorganized data with no clear format.
To gain insight from unstructured data, the dataset needs to be analyzed.
The hardest part of analyzing unstructured data is teaching an application to understand the information it is extracting from the data.
The specifics of how this is done vary from format to format.
Working with unstructured data is labor-intensive, involving complex algorithms such as those in machine learning, AI, and natural language processing.
About 80% of the world’s big data comprises unstructured data.
These data are stored in data lakes, which preserve the raw format of the data and all of the information it holds.
An example of unstructured data is a heterogeneous data source containing a combination of simple text files, images, videos, etc.
3. Semi-structured data
Semi-structured data is unstructured data that is organized in some way, making it easier to process than purely unstructured data.
Semi-structured data often has metadata (data that describes or gives information about other data) attached to it, e.g. time, location, device ID stamp, email address, etc.
Using the right datasets, semi-structured data is a huge asset as it can inform AI training and machine learning by associating patterns with metadata.
For example, if you take a selfie on your smartphone, it might attach a timestamp to the photo and log the device ID.
The image itself is unstructured data, but these additional details provide some context.
Also, after taking a picture on a phone, the device logs the time the picture was taken, the GPS data at the time of the capture, the device ID, etc.
In the above situations, the actual content of the data is still in an unstructured format, but with the metadata, the data can be grouped based on certain tags or characteristics.
Characteristics (the Vs) of big data
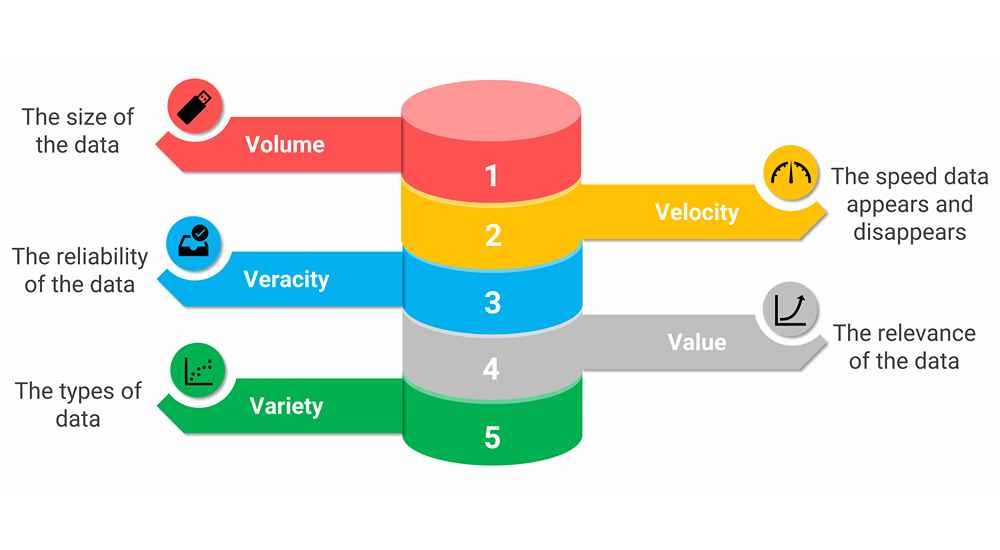
Douglas Laney, a data expert, came up with a list of the 3 Vs of big data in 2001, including Volume, Velocity, and Variety, that separates big data from other data.
1. Volume
Volume is the most commonly mentioned characteristic of big data.
Big data is huge data that is growing constantly.
The amount of data in the world was estimated to be 44 zettabytes at the beginning of 2020.
Big data consists of high volumes of low-density, unstructured data.
Organizations collect data from a variety of sources, including transactions, smart (IoT) devices, industrial equipment, videos, images, audio, social media, and more.
The size of data plays a very crucial role in deriving value from it. In the past, storing all that data would have been too costly, but there are cheaper data storage options available now.
2. Velocity
The speed of data generation and processing is another characteristic of big data.
Our ever-connected world means that companies are inundated with data. With the growth of the Internet of Things, data is coming in constantly and at an unprecedented speed.
Internet users with a connected device surf the internet or use social media to generate their stream of data.
Received data needs to be handled promptly.
In many cases, sets of big data are updated on a real- or near-real-time basis instead of the daily, weekly, or monthly updates made in many traditional data sets.
Managing data velocity with machine learning and artificial intelligence (AI) is therefore vital in that these analytical processes automatically find patterns in big data and use them to generate insights.
3. Variety
This is the attribute that makes big data so complex: the heterogeneous sources and the nature of the data.
Big data comes in from different sources and in different forms: video, text, image data, audio data, real-time data, etc
The data ranges from structured, that is, numeric data in traditional databases, to unstructured data, including emails, videos, audio, and so on.
Unstructured and semi-structured data types, such as text, audio, and video, require additional preprocessing to derive meaning.
The variety of big data, especially in terms of unstructured data, poses certain issues for data storage, mining, and analysis.
Big data flows are unpredictable, changing often and varying greatly.
Data sets may have multiple meanings or be formatted differently in separate data sources—factors that further complicate big data management and analytics.
4. Veracity
This refers to the quality of the data, the degree of accuracy in the data sets, and how trustworthy the data are.
Big data comes from many different sources; hence, it is difficult to process and manage this data across systems, a necessity for businesses, as without proper data handling, their data can quickly spiral out of control.
Processing bad data leads to analysis errors that can undermine the value of business analytics initiatives.
5. Value
Not all the data that’s collected applies to every organizational use case and has real business value and benefits.
Hence, organizations need to watch out for this and confirm that data sets relate to relevant business issues before being used in big data analytics projects.
Sources of big data
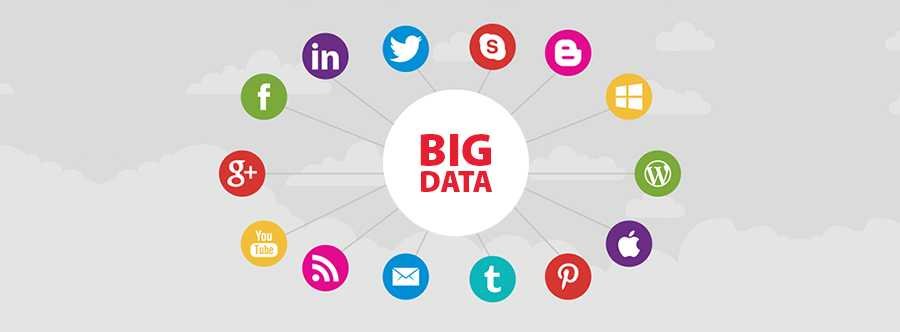
1. Social media data
Data generated from social media platforms like Facebook, Twitter, etc. is included here.
They are large sets of data generated when people interact with others online, like one another’s content, tweet, leave comments on posts, send images, indicate location check-ins, etc.
2. Health data
Health data refers to the abundant patient information amassed from numerous sources, including electronic health records (EHRs), medical imaging, genomic sequencing, payer records, pharmaceutical research, wearables, medical devices, etc.
Health data is generated when patients and end-users interact with healthcare professionals or through continuous monitoring technologies like wearables; hence, it is created daily, in large sums, and different formats.
3. Machine data
This is data generated automatically by machines without the active involvement of a human, including those by computers, applications, devices, and gadgets.
Examples include data from medical device sensors, smart devices, financial transactions, network and server log files, data from sensors on manufacturing machines, industrial equipment, etc.
4. Transactional data
This is information that documents a transaction between two or more entities.
Examples include receipts or invoices for a purchase, documents finalizing a contract, receipts for money withdrawal from a bank account, reservation documents for booking a hotel room, etc.
Importantly, the transaction does not necessarily have to be financial; it can be any kind of exchange or agreement among concerned parties.
How to use big data
Big data is a vital asset to businesses in several industries, as insight from their analysis helps businesses make better decisions, among other uses.
To analyze big data and take advantage of it, the following basic steps are applicable:
1. Creating a big data strategy
To manage their data, organizations first need to create an analysis strategy and a pathway for the acquisition, storage, management, and use of data within and outside their facilities.
This big data strategy serves as the data road map in the organization; it sets the stage for success amidst the large sets of data, as, without it, the available data cannot be put to efficient use.
2. Management and storage
A lot goes into data management including data integration, building data pipelines, data quality, data governance, and then data analysis.
Big data requires storage, whether in the cloud, on-premises, or both.
Big data may be stored on-site in traditional data warehouses.
The cloud is popular because it is a low-cost option for storing and handling big data, supports the user’s current computing requirements, and enables them to add more resources as needed in the same space.
3. Analyzing big data
This is the mainstay of data management; big data analytics is how organizations gain insights from their data.
Investment in big data pays off when the data is analyzed and the insights put to use.
Data models with machine learning and artificial intelligence are being used to put big data to work.
4. Insight visualization and decision-making
As earlier stated, data is analyzed to provide organizations with information about users.
Upon analysis, data insight is visualized in an easy-to-understand format for industry leaders to make better decisions regarding users and for organizations to stay competitive and perform better than competitors.
Uses of big data
To derive usefulness from large data sets, they must first be analyzed.
Big data analytics uncovers patterns and trends that give an idea of what works, what’s not working, and what might work well in the future.
- Big data insights give organizations a competitive edge over others, being the driving force behind smart business decisions.
- Automate some operational processes, boosting efficiency and saving time, money, and resources in the process.
- Uncover new potential revenue streams.
- Introduces improved strategies for user acquisition and retention
- Achieve more precise audience segmentation, allowing the offer of customized products and services, resulting in better user service and satisfaction.
- Accurately forecast and allocate organizational resources, streamlining their management
- Insight from previous user interactions helps organizations provide better customer service
- Identifying and mitigating potential operational risks
- Determining the causes of mistakes and failures.
- Improved user personalization and recommendation, especially with online ads, streaming services, etc
- Better fraud prevention and cybersecurity means detecting fraudulent behavior before much is lost.