Healthcare data analysis
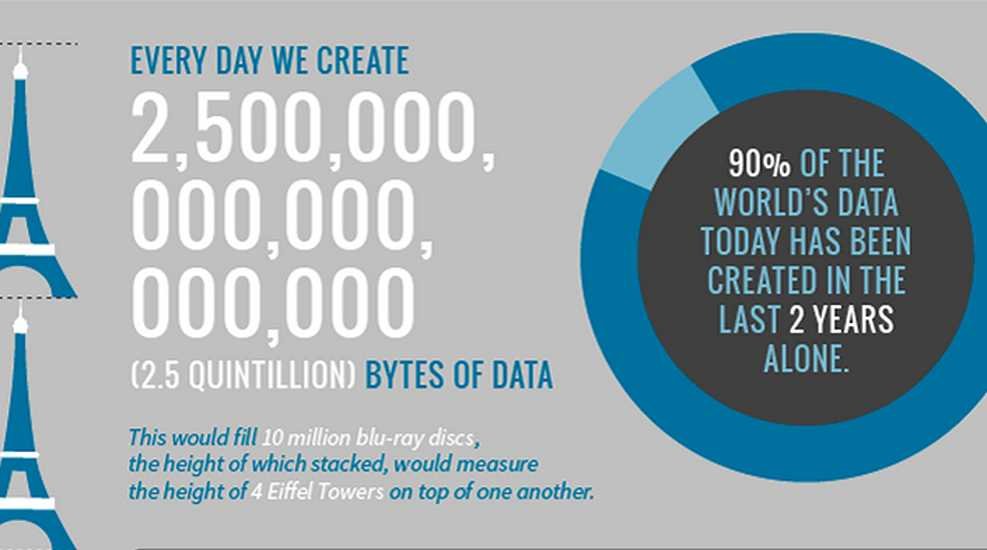
In the world today, over 2.5 quintillion bytes of data are created every single day.
Despite this large data volume created every day, only a mere 0.5% is analyzed and useful to industries around the world for data discovery, improvement, and intelligence.
Hence, understanding how to analyze and extract meaningful information from raw data is one of the primary drivers of success across industries.
This is especially useful in an industry like the healthcare industry, where the analysis of large sets of health data can yield improvements in patient care, lead to faster and more accurate diagnoses, hasten the development of disease prevention strategies, and, from a business perspective, help lower running costs and simplify operations.
The concept of big data refers to data that is so large, generated quickly, and largely complex that it is difficult or impossible to process using conventional data processing methods.
These are known as the 3Vs of big data: volume, velocity, and variety.
Health data is a major type of big data.
Health data is any data relating to the health of an individual patient or a collective population.
In today’s world, health data is largely processed by health facilities using health information technologies and then broken down into specific datasets that can be analyzed.
With digital data collection, especially via mobile applications and IoMT, in real-time, there is more and more health data to be analyzed.
These data sets are so complex that traditional processing software and storage options cannot be used.

Health data has the potential to improve healthcare delivery by deriving insights from analysis of the vast amounts of available data in the industry.
Health organizations make use of health information technologies in the management of health data.
These information systems play a part in the analysis of health data.
While the majority are not built for data analysis, they help in the collection and preparing the data for analysis.
They help establish data-sharing and storage standards as well as in the development of methodologies for data aggregation and analytics.
And eventually, after data analysis, they come in useful in translating derived insights into effective clinical practices.
Data Analytics
Data analytics (DA) is the process of examining data sets to find trends and draw conclusions about the information they contain – Techtarget
Data analytics is the science of analyzing raw data to derive useful information for better decision-making.
It helps organizations optimize their performance, become more efficient in their operations, reduce running costs, maximize profit, etc.
Data analysis is often employed when big data is involved.
It helps organizations reduce the risks inherent in decision-making by providing useful insights from relevant data.
These insights are often presented in charts, images, tables, graphs, etc
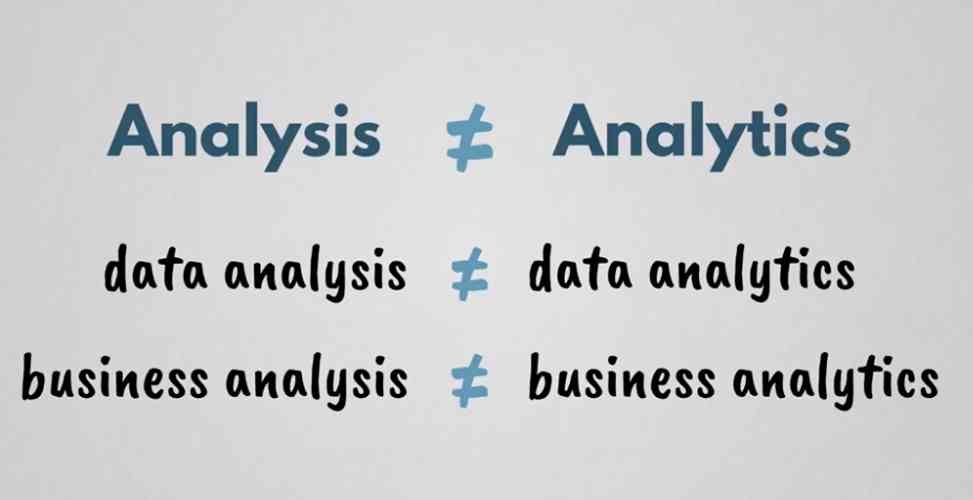
It is worth noting that analytics is not analysis.
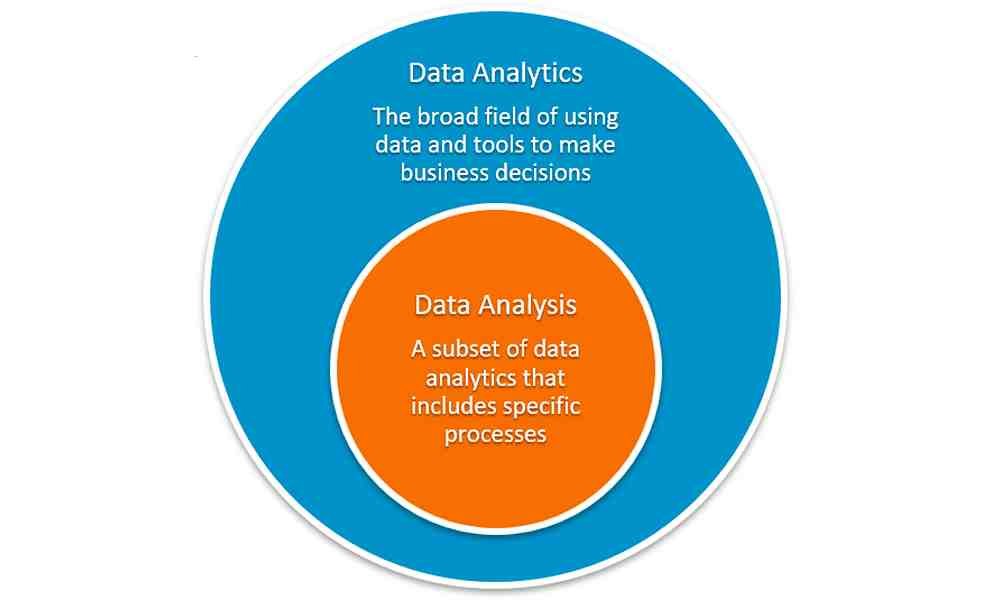
Data analytics is a broad field of using data and tools to make business decisions; data analysis is a subset of analytics.
Data analytics helps to predict future value; it is useful when finding what will happen or what is going to be next, while data analysis manipulates data to understand what has happened and is more historical in its approach.
Both, however, are interwoven, and are necessary to understand the data.
Analytics are all activities, both human and machine (automation using artificial intelligence algorithms, etc.) enabled, related to investigating data for hidden answers, including finding trends, uncovering opportunities, predicting opportunities, and making decisions.
This goes beyond the terrain of just data analysis.
Comparing data analytics with similar disciplines
1. Data analytics vs data science
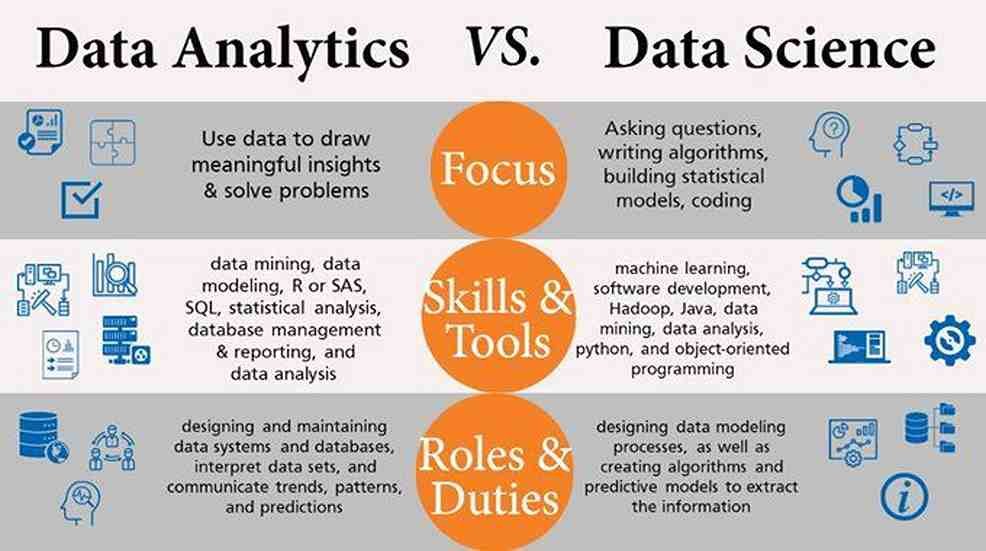
Data science is a robust field compared to data analysis and has to do with interacting with data to forecast future events based on patterns and trends of the past.
It is multidisciplinary and involves data analytics, software engineering, data mining, machine learning, predictive modeling, etc.
Data analytics uses existing data to uncover meaningful insight and arrive at actionable information, it answers questions generated for better decision-making.
While data science estimates the unknown by asking questions, writing algorithms, and building statistical models, data analytics, on the other end, is specific and focuses on specific areas with specific goals—making use of data to draw meaningful information for better decision-making.
2. Data analytics vs Health informatics
Health informatics and analytics are two separate disciplines.
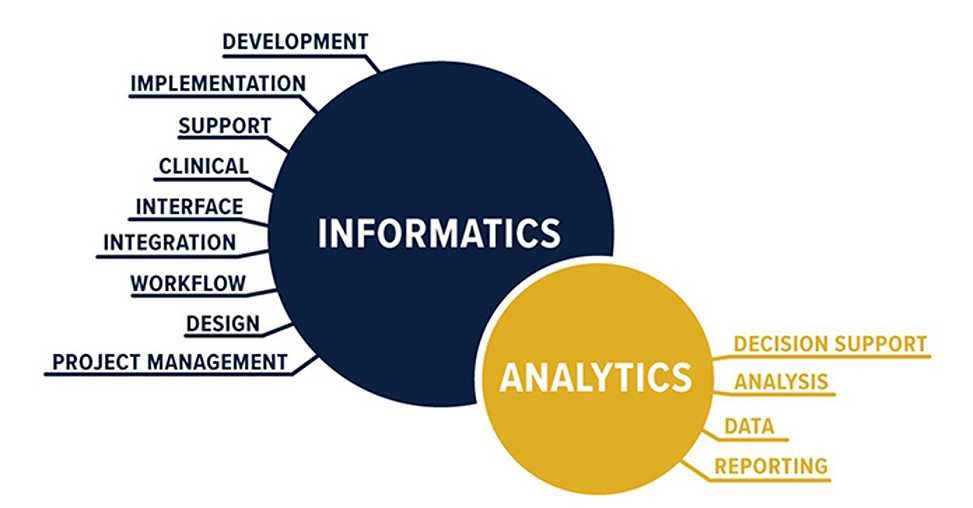
Data analytics explores the many ways health data can be utilized, it is largely analytical, examining health data for actionable insights.
Health informatics on the other hand applies the insights derived from data analytics to aid health services efficiencies.
Data analysts manage health data acquired by health information technology in health information systems to report current and future predictive outcomes, looking for insights into how healthcare organizations can improve clinical care and operations efficiencies.
In an article by the American Health Information Management Association (AHIMA), while both data analytics and informatics are different, they are essential for the success of healthcare organizations.
Health data analytics refers to analysis using quantitative and qualitative techniques to explore trends and patterns in data, while health informatics involves the use of the information derived from data analytics to improve the delivery of healthcare services and patient outcomes.
Data analytics involves the analysis of data, while informatics is the application of that information” – Jonathan Mark, University of San Diego
Worthy of note, while being different, the roles aren’t always so distinct.
Processing health data is a continuum, from generation to storage, structuring, analyses, insight deduction, and finally the application of derived insight, both informatics and analysts are involved throughout the majority of the data management, and hence, the delineation in duty between both fields is thin.
There are yet several overlaps in the scope of both fields, however, each helps the other towards a common goal of improving operational efficiencies and clinical care.
3. Data analytics vs Data reporting

While both have to do with getting value from data, reporting is very much different from analytics.
Data reporting refers to the process of organizing, summarizing, and presenting data in an easy-to-understand and user-friendly manner while analytics is about adding value by deriving useful insights from data to help inform a decision.
Reporting is largely defined, and only presents data in a more digestible manner, unlike analytics which seeks trends and insights from data.
Reporting follows a standardized way of presenting information, while analysis is largely customized as per the project’s needs.
Types of Data Analytics
1. Descriptive analytics
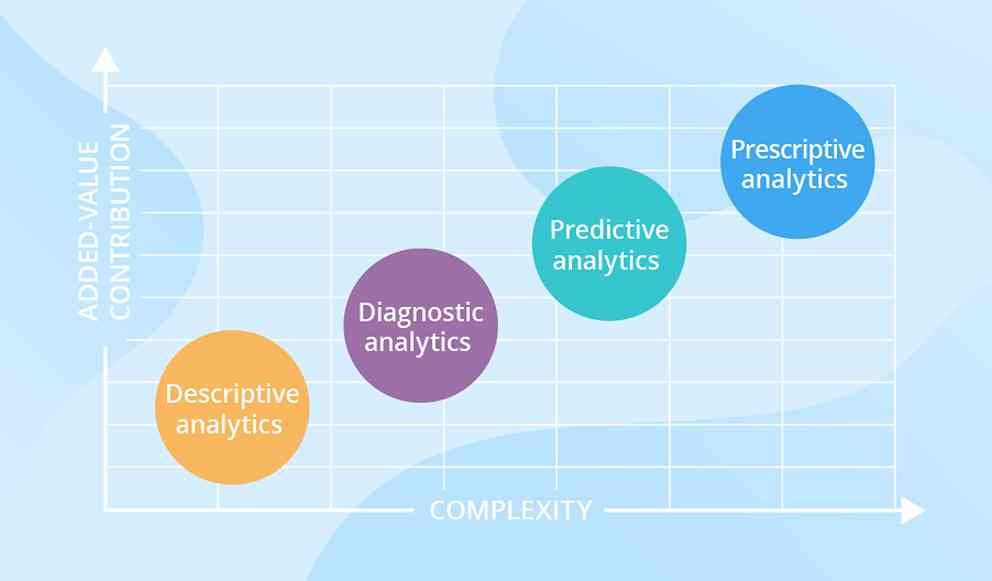
This answers the question of what happened.
This helps to analyze and describe the features of data, leading to the summarization of information.
When coupled with visual analysis, descriptive analysis provides a comprehensive structure of data. describes what has happened over a given period.
Has the number of views gone up? In the descriptive analysis, we deal with past data to draw conclusions and present our data in the form of dashboards.
For example, it can be used to determine how contagious a virus is by examining the rate of positive tests in a specific population over time.
2. Predictive analytics
This answers the question of what will happen.
Predictive Analysis shows the likely outcome by using previous data. It makes use of descriptive analysis to generate predictions.
With the help of technological advancements and machine learning, we can obtain predictive insights about the future.
This is a complex field that requires a large amount of data, a skilled workforce that is well-versed in machine learning to develop effective models, and then a skillful implementation of these predictive models to obtain accurate predictions.
Predictive analytics moves to what is likely going to happen in the long term.
For example, it can be used to forecast the spread of a seasonal disease by examining case data from previous years.
3. Diagnostic analytics
This answers the question of why something happened.
Diagnostic analytics focuses more on why something happened, finding the cause of an outcome.
It is useful to identify the behavior patterns of data.
If a new problem arises, this analysis can be used to find similar patterns to that problem and apply solutions to those similar problems to the new problem.
With diagnostic analysis, you can diagnose various problems that are exhibited through your data.
Businesses use this technique to reduce their losses and optimize their performances.
For example, it can be used to diagnose a patient with a particular illness or injury based on the symptoms they’re experiencing.
4. Prescriptive analytics
This answers the question of how something will happen.
Prescriptive Analysis combines the insight from all previous analyses to determine which action to take in a current problem or decision.
Based on current situations and problems, this type of analytics analyzes data to make decisions.
Prescriptive analytics suggests a course of action.
Commonly referred to as the final frontier of data analytics, the prescriptive analysis combines insights from all other analytics types and makes use of AI to facilitate companies in making careful business decisions.
For example, it can be used to assess a patient’s pre-existing conditions, determine their risk for developing future conditions, and implement specific preventative treatment plans with that risk in mind.
5. Exploratory analysis (EDA)
EDA is a different type of data analysis commonly used by data scientists to analyze and summarise data sets, by highlighting their main characteristics often with the aid of data visualization methods.
EDA provides a better understanding of the relationship between dataset variables.
They help to reveal details about data beyond what data science modeling or hypothesis testing can provide.
This is useful in refining data sources to best derive datasets for data science projects and as well determine if the statistical techniques being considered for analysis are appropriate.
Data analytics process
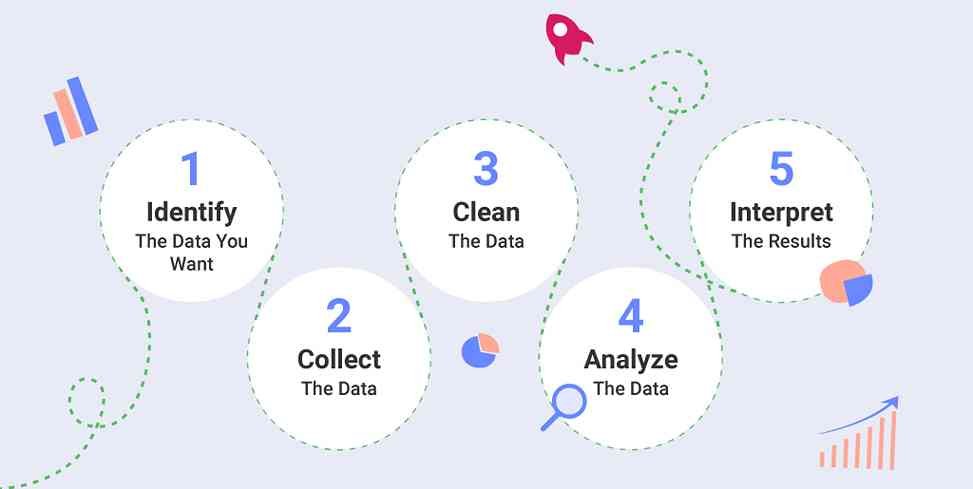
The data analysis process is a collection of steps required to make sense of the available data.
Each step is equally important to ensure that the data is analyzed correctly and provides valuable and actionable information.
Let’s take a look at the five essential steps that make up a data analysis process flow.
The Data analytics process is nothing but gathering information by using a proper application or tool that allows you to explore the data and find a pattern in it.
Based on that information and data, you can make decisions, or you can get ultimate conclusions.
1. Define why you need data analysis
Identify what questions the organization needs data to answer.
The first step in a data analysis process is determining why you need data analysis.
You need to find out the purpose or aim of analyzing your data.
You also have to decide which type of data analysis you want to do.
In addition to finding a purpose for the analysis and identifying the type of analysis to deploy, consider which metrics to track and measure throughout the process.
Considering how tedious this can be, many employ the use of a roadmap, a tool that prepares you for all the necessary steps.
2. Data collection
Collects data from which sources, assess their relevance, and how to use them. Surveys, questionnaires, etc
The second step in data analytics is the process of collecting data.
Data collection usually starts with primary/internal sources, typically structured data gathered from CRM software, ERP systems, marketing automation tools, and others.
While it’s not required to include data from secondary/external sources, those could add another element to an analysis.
This is important because the nature of the collected data sources determines how in-depth the analysis is.
Secondary data sources include both structured and unstructured data that can be gathered from computers, online sources, cameras, environmental sources, or personnel.
It is good practice as well to keep a log of data with collection dates and the source of the data.
3. Data cleaning
Removal of duplicate data, formatting errors, irrelevant data sets/sources, white spaces, etc
This is the next step in analyzing the data collected.
Data cleaning is important because not all data, howbeit from necessary sources, is good data.
The data collected may not be useful or irrelevant to the aim of the analysis, hence it should be cleaned.
Analysts must identify and remove duplicate data, anomalous data, white spaces or errors, and other inconsistencies that could skew the analysis, preventing the generation of accurate results.
This is a tasking step in analyzing data as research reveals that 80% of a data scientist’s time in data analysis is spent on cleaning data.
Worthy of note, with advances in the input of machine learning platforms in data analysis, more intelligent automation is being used to save data analysts valuable time while cleaning data.
4. Data analysis
Deployment of analysis techniques towards finding trends, variations, etc
This is the mainstay of the process, of analyzing and manipulating data to derive actionable insights.
There are several approaches to this, depending on the type of analysis to be used.
Once the data is collected, cleaned, and processed, it is ready for Analysis.
During data manipulation, analysts may find exactly what they set out to find or need to collect more data.
To understand, interpret, and derive conclusions from data, analytics tools are used.
5. Data interpretation
Coming up with visualizations and courses of action based on findings from the analysis.
This is the last step.
After analyzing the data, it’s time to interpret the results.
There are several ways this is down, including data visualization and business intelligence software.
Data visualization is very common in day-to-day life; it often appears in the form of charts and graphs, i.e. data shown graphically so that it will be easier for the human brain to understand and process it.
There’s also business intelligence…
Both data visualization and business intelligence, are optimized to help decision-makers understand insights from data analysis by generating easy-to-understand reports, dashboards, scorecards, and charts.
The results of the data analysis are then used to decide the best course of action.
Obisesan Damola
Damola is a medical doctor who has worked in the Nigerian healthcare industry for a little over 3 years in a number of primary, secondary, and tertiary hospitals. He is interested in and writes about how technology is helping to shape the healthcare industry. He graduated from the College of Medicine, University of Ibadan, the foremost medical training institution in Nigeria.

