Data science in healthcare
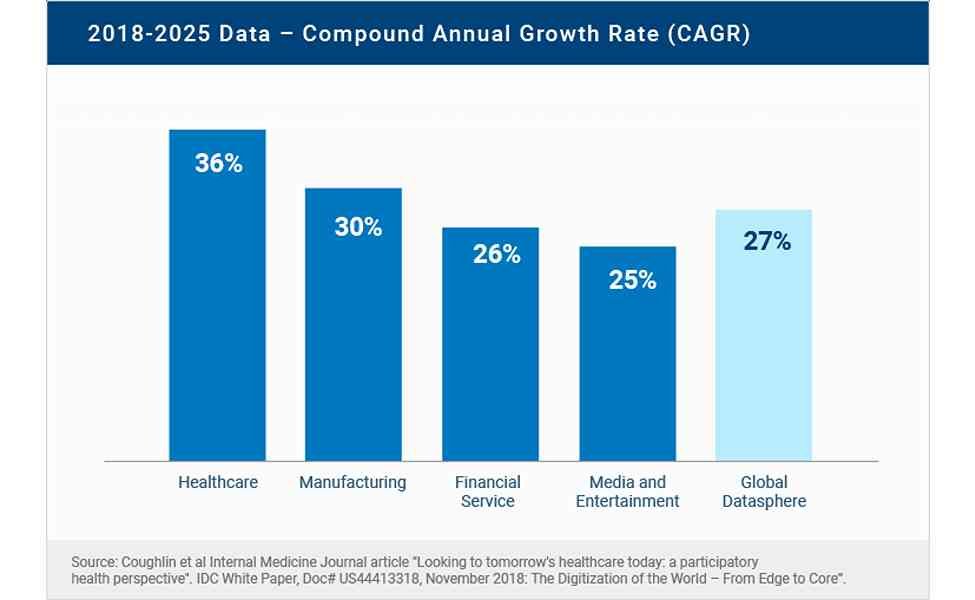
The healthcare industry is swimming in large sets of data, this includes useful information on patient demography, treatment plans, examination details, health insurance information, etc.
This data requires effective management and analysis to provide practical insights and aid in the decision-making of strategic decisions in the healthcare industry.
Data-driven decision-making opens up new possibilities to boost the quality of healthcare delivery.
Data science has now become an integral part of almost every industry and helps in the management of this big health data.
It provides opportunities for the healthcare industry to collect, organize, and analyze health data efficiently, improve health outcomes, predict disease trends, improve diagnostic accuracy, etc.
Summarily, data science offers healthcare the opportunity to take a value-based, data-driven approach to care.

The concept of big data refers to data that is so large, generated quickly, and largely complex that it is difficult or impossible to process using conventional data processing methods.
These are known as the 3Vs of big data: volume, velocity, and variety.
Health data is a major type of big data.
Health data is any data relating to the health of an individual patient or a collective population. In today’s world, health data is largely being processed by health facilities using health information technologies.
With digital data collection, especially via mobile applications and IoMT in real-time, more and more health data is being generated These data sets are so complex that traditional processing software and storage options cannot be used to put them to use.
The data science platform

The data science platform is a software hub that comprises a variety of technologies for advanced analytics and machine learning and also houses all data science projects.
It is from here that data analysis and other steps in the data science cycle take place.
It offers the required resources for undertaking data science projects.
The platform is widely used in industries around the world, including healthcare, as it allows data scientists to run, track, replicate, analyze, and, most importantly, collaborate on projects.
The data science platform market was valued at USD 44.98 billion in 2020 and is projected to reach USD 392.46 billion by 2028, growing at a CAGR of 30.5% from 2021 to 2028.
Data Science
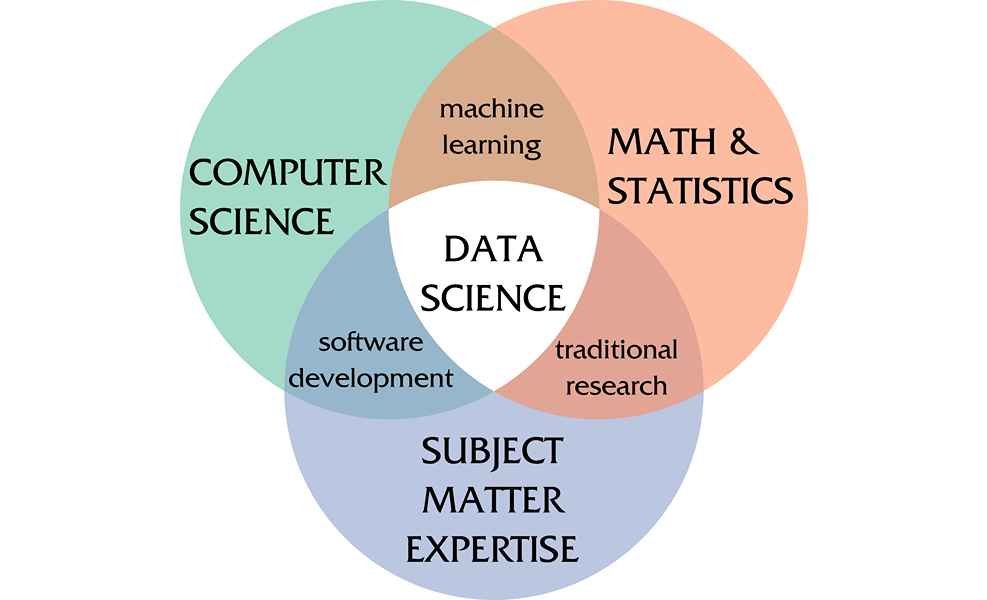
Data science is an interdisciplinary field of computer science that makes use of software, machine learning tools, statistical practices, and theory to process complex data sets to draw insights from them and, importantly, forecast likely future trends.
Organizations rely on data science to interpret the big data they work with to make critical decisions and stay competitive in their respective industries.
The use of machine learning concepts in data science helps to create models that automate the decision-making process to solve complex real-world organizational problems.
Data science is a multidisciplinary approach to extracting actionable insights from the large and ever-increasing volumes of data collected and created by today’s organizations.
Data science encompasses preparing data for analysis and processing, performing advanced data analysis, and presenting the results to reveal patterns and enable stakeholders to draw informed conclusions. – IBM
With the emergence of new technologies, there has been an exponential increase in data.
This data assists an organization in making better decisions.
This data-driven approach to decision-making is undertaken using data science.
Data science can be applied to any industry that processes a large amount of data to study, including healthcare.
The majority of healthcare data is in unstructured form; hence, understanding it requires an advanced approach.
Here, data science is used to improve the accuracy of diagnoses, drive research for disease cures, and track the spread of communicable diseases, among other benefits.
Comparing data science with similar disciplines
1. Data science vs data analytics
Data science is a robust field compared to data analysis and has to do with interacting with data to forecast future events based on patterns and trends from the past.
It is multidisciplinary and involves data analytics, software engineering, data mining, machine learning, predictive modeling, etc.
Data analytics uses existing data to uncover meaningful insight and arrive at actionable information; it answers questions generated for better decision-making.
While data science estimates the unknown by asking questions, writing algorithms, and building statistical models, data analytics, on the other end, is specific—making use of data to draw meaningful information for better decision-making.
2. Data Science vs Business intelligence
Business intelligence converts data into information that can support business leaders in decision-making.
It focuses on analyzing past events and, hence, is backward-looking to discover previous and current trends.
Data science involves creating forecasts by analyzing the patterns behind the raw data and aims to predict future trends.
It is forward-looking.
It is the more technical skill set of the two and is designed to handle more complex, unstructured datasets.
While business intelligence makes use of basic statistics with an emphasis on visualization tools like dashboards and reports, data science leverages sophisticated statistical, predictive analysis, and machine learning (ML) technologies.
Data science lifecycle
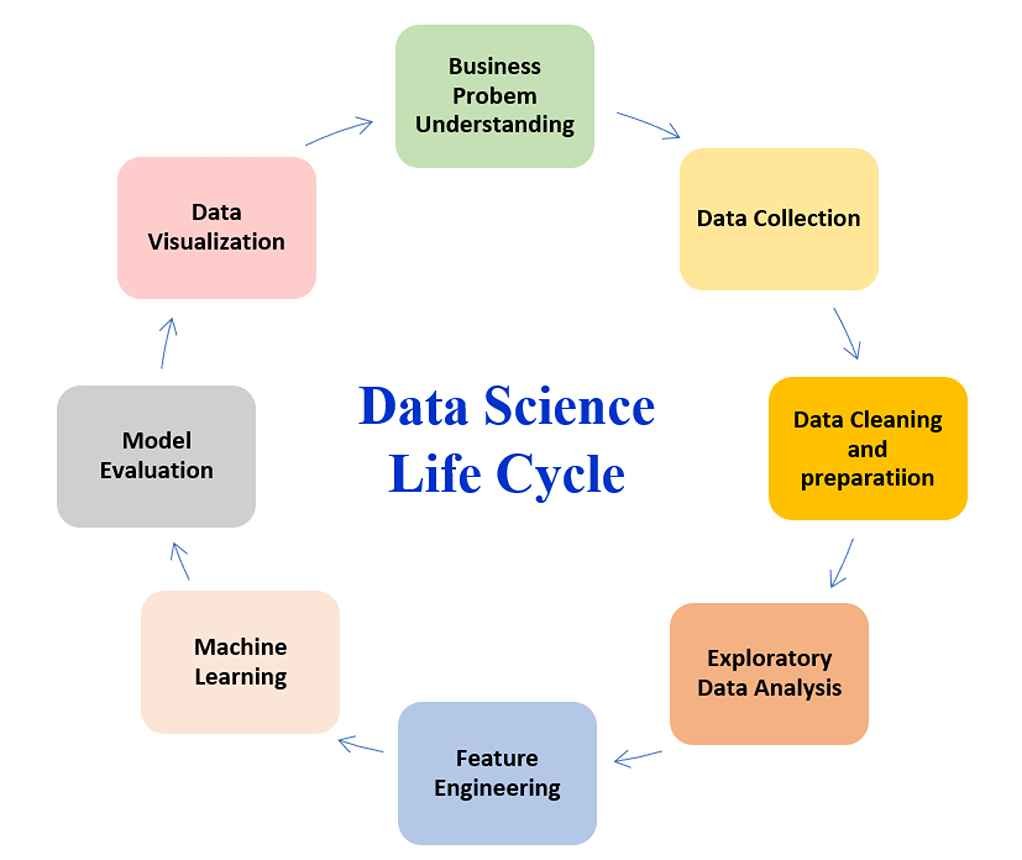
Also called a data science pipeline, the data science life cycle is a step-by-step process of how analytical methods, including machine learning, are used to generate insights and make predictions from data in data science projects.
Each project is unique and follows a different pathway, but they are all largely patterned after the steps listed in the life cycle.
The steps in the life cycle include business problem understanding, data collection, data cleaning and preparation, exploratory data analysis, feature engineering, machine learning, model evaluation, and finally, data visualization.
Each of the steps is important and requires careful execution, as the success of the entire project is dependent on it.
1. Business problem understanding
This is a crucial step in any data science project; it has to do with understanding in what way data science is useful in the domain under consideration—the healthcare industry.
It is essential to understand the project objectives clearly because that will determine the goal of the process.
This is where domain experts (healthcare professionals) come in, working hand-in-hand with data scientists to identify the details of the problem that needs to be solved with data science.
Domain experts have in-depth knowledge of the application domain and know exactly what problem needs to be solved, while data scientists understand the application domain and help identify appropriate tasks that would be useful for the project.
These professionals work to clearly state the problem to be solved, define the potential value of the project, identify associated risks, including ethical considerations, and come up with a project plan.
2. Data collection
This step involves the identification and collection of relevant data sources for the project.
These health data, whether structured or unstructured, are processed into usable formats.
The prior step of understanding project problems that need to be solved would determine the sources of data for the project.
Conventional data sources include surveys, social media, enterprise, transactional data, etc.
There are also health data repositories including the World Health Organization (WHO), the Center For Disease Control (CDC), Open Science Data Cloud (OSDC), etc
Data science projects are centered around data; hence, the right data collection methods must be employed in collecting data from relevant data sources for the project.
3. Data cleaning and preparation
Arguably the most time-consuming step of the life cycle, data preparation involves putting raw data into an appropriate format for analytics, including making it usable for machine learning or deep learning models.
This step is important because the model to be deployed for the project can only be as good as the available prepared data.
Data preparation includes data cleansing, deduplication, staging, reformation, etc.
Collected data are understandably in different complex formats, seeing as they are from different sources.
These are extracted, processed into a single format, and stored in typically a data warehouse where extract, transform, and loading (ETL) operations are performed.
Usually carried out by data architects, the ETL process is a vital part of this stage that looks into selecting the relevant data, integrating the data by merging the data sets, cleaning them, treating the missing values, treating erroneous data by removing them, etc.
4. Exploratory data analysis (EDA)
Once the data is available and ready in the required format, the next step is to understand the data.
This understanding comes from the analysis of the data.
EDA is a type of data analysis used to summarise data sets by highlighting their main characteristics, often with the aid of data visualization methods, e.g. bar graphs, etc.
This step involves getting some idea about the data before building the actual data science model.
EDA provides a better understanding of the relationship between dataset variables, beyond what data science modeling can provide.
This is useful in refining data sources to identify important variables in the data set and remove all unnecessary data details that may hinder the accuracy of machine learning model conclusions.
Analysis tools like Tableau, PowerBI, etc. are employed in this step.
5. Feature engineering
Feature engineering refers to the manipulation of datasets to improve machine learning model training, leading to better performance and greater accuracy.
Data features are the characters or a set of characteristics of a given dataset, i.e., the data fields or attributes, usually numerical or in any measurable form.
Success in feature engineering is based on the success of the prior steps, including sound knowledge of the project objectives or business problem and the available data sources.
This step involves creating new features to enhance the machine learning model, which gives a deeper understanding of data and results in more valuable insights.
This is a valuable step in data science howbeit challenging.
Common types include filling missing values based on expert knowledge, feature selection (removing unimportant and redundant features), feature construction (creating new feature(s) from one or more other features), etc.
6. Machine learning data modeling
This step involves the development of the machine learning model.
Models are mathematical algorithms trained using data to enable autonomous decision-making processes when deployed on real-world data.
These models represent decision processes in abstract manners, and upon deployment, they generate outputs (decisions) and, ideally, explain the reasons behind their decisions to help understand the decision process.
Developing models starts with choosing the appropriate type of model, which would depend on the desired value of the project.
Model types include predictive (provides future predictions), descriptive (helps to understand relationships within the system they represent), and decision models (helps manage organizational principles and decisions).
Usually, models are first tested and trained with prepared data, following which they are exposed to real-time data in the real world.
7. Model Evaluation
This step makes use of evaluation metrics to understand a machine learning model’s performance.
Model evaluation is important to assess the efficacy of a model.
There are two methods of evaluating models: hold-out and cross-validation.
Irrespective of the evaluation method used, a test data set is involved.
This data set has not been seen by the model before the evaluation, which helps evaluate the performance of the model and eliminate bias.
If the evaluation does not produce a satisfactory result, a new model has to be generated.
This is repeated until the desired level of the model metric is achieved.
8. Data visualization
This is the last step of the cycle and involves presenting insights derived from the model using reports, charts, and other data visualization tools for decision-makers to easily understand.
Insights are passed through data reporting (help assess the achievement of key process indicators in the organization) and visualization software to present them in an easy-to-understand manner to drive strategic organizational decisions and growth.
In addition to improved decisions, there are other benefits of data science projects, details of which are included later in this post.
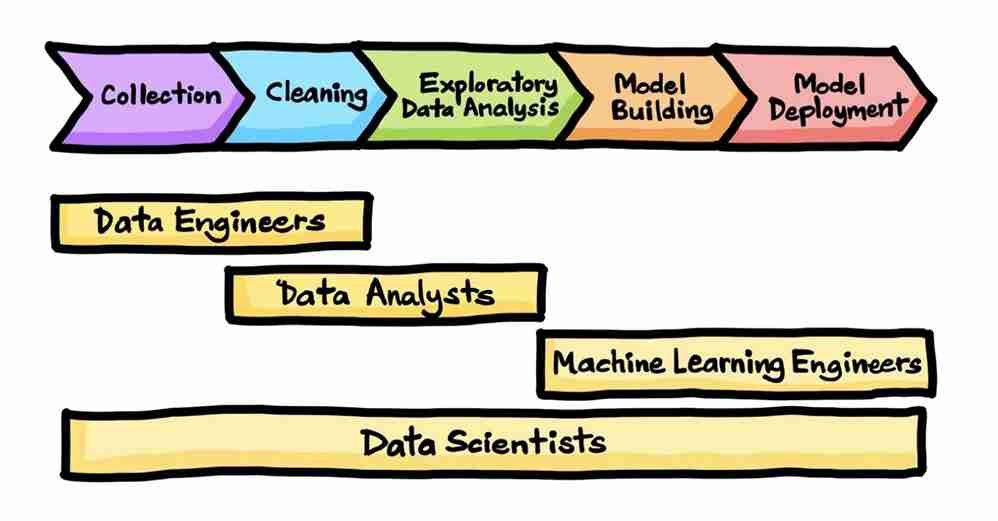
A data science project involves several data professionals working on the different steps in the project cycle.
Aside from data scientists, other professionals include data analysts, data engineers, machine learning engineers, etc.
Obisesan Damola
Damola is a medical doctor who has worked in the Nigerian healthcare industry for a little over 3 years in a number of primary, secondary, and tertiary hospitals. He is interested in and writes about how technology is helping to shape the healthcare industry. He graduated from the College of Medicine, University of Ibadan, the foremost medical training institution in Nigeria.
